In the SOCIFI Dashboard, you can see all of the important analytical data about your brandsBrands, campaigns, Campaigns and connectionsConnections.Whenever you hover over an item, without clicking it, a tooltip will appear - with information about that item.
If you would like to see statistic for a selected period of time click on the calendar icon in the upper right corner and select the time frame by clicking on the first and last date for the time period you wish to see.

To download this data click on the icon next to the calendar. A drop-down menu will appear with the “Export Users to CSV” option.
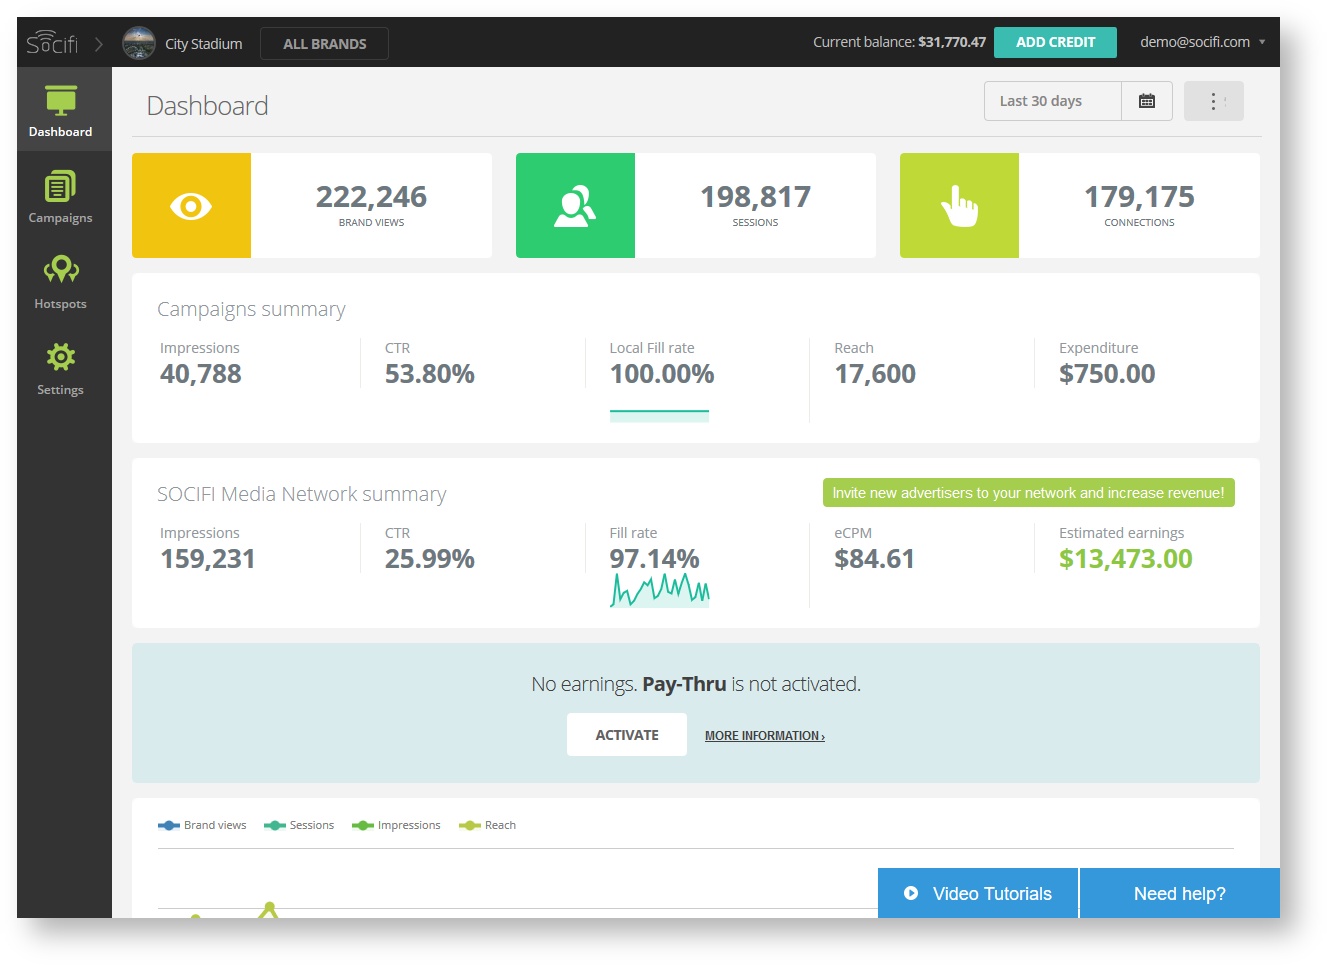
The main overview (pictured below) shows the number of brand Brand views, sessions Sessions and connectionsConnections.

The campaigns Campaigns summary gives you an overview of your ads performance and reachReach.

If you activate SOCIFI Media Network you will see the summary visible in the Dashboard.
...
We also measure performance metrics such as the bounce Bounce rate and page Page load time.

When you allow your customers to login with their Social Networks and e-mail, we will collect data about your visitors and display it in a pie chart so that you can easily see who your customers. Data that is public or willingly shared by your customers can be easily downloaded to MailchimpMailChimp, Salesforce and other poplular popular email marketing systems.

...